Introduction:
This article analyzes the funding and achievement gaps of New York State’s K-12 public schools, with a focus on differences among schools in rural, suburban and urban areas. New York’s public education system has one of the highest rates of per-pupil spending in the country, even after accounting for regional cost differences. In fact, it received the highest grade of any state (B+) in a 2016 education finance study by Education Week. However, a closer look at education “equitability” indexes reveals “average” performance on New York State’s efforts to provide equal educational opportunity to children of different socioeconomic backgrounds. This reflects a broader controversy-namely, that public school education is funded in varying degrees by local property taxes, a situation which has drawn criticism for perpetuating historical and existing societal inequalities.
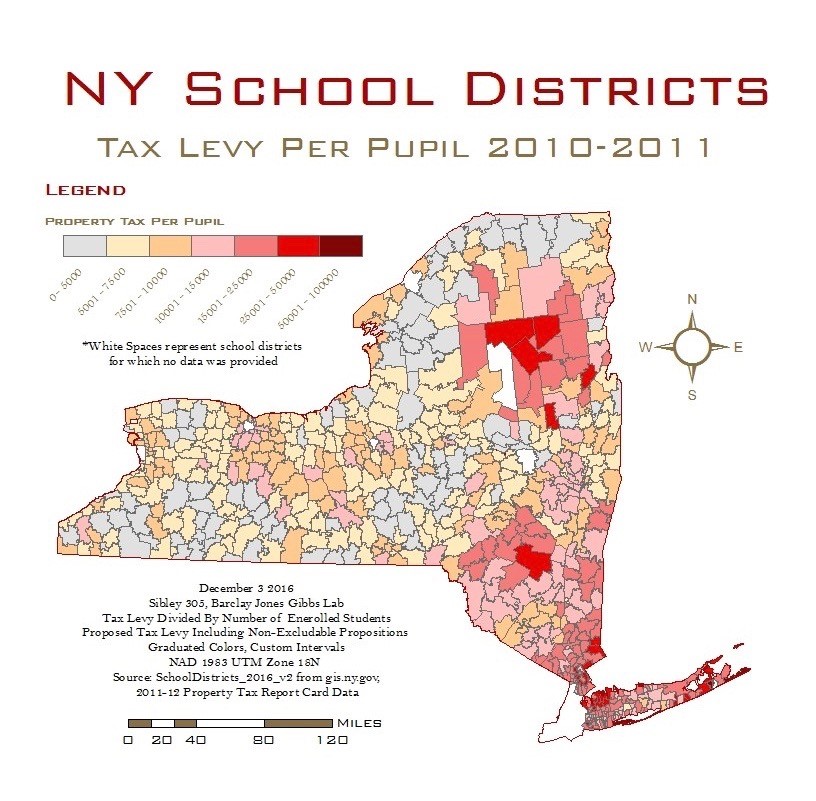
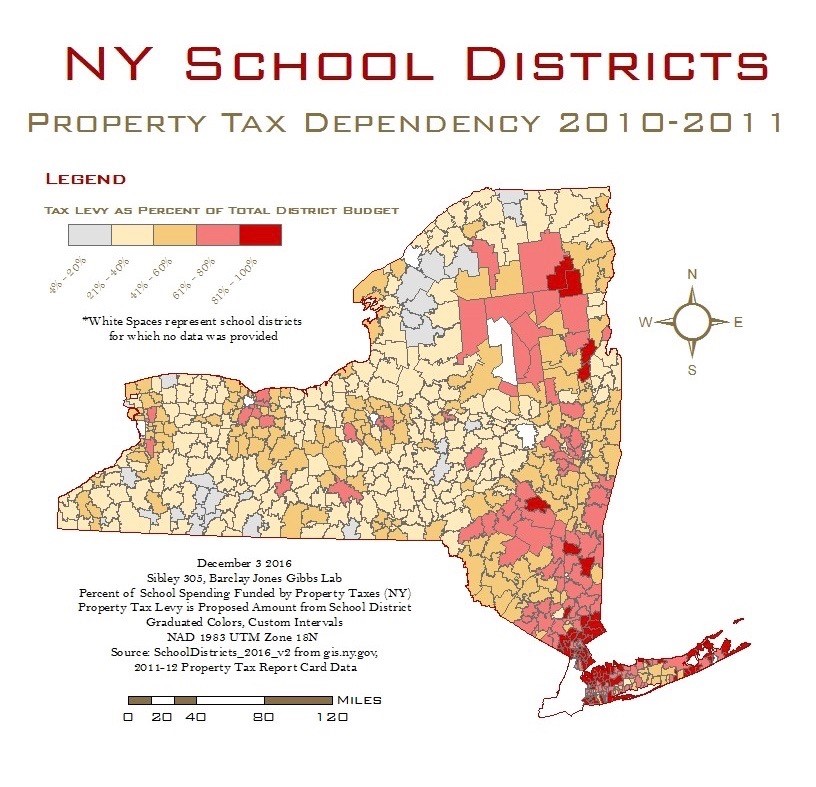
Generally speaking, higher dependence on local property taxes (as opposed to state or federal funding) contributes to greater inequality. Wealthy families tend to reside in neighborhoods with higher property values, and as a result those local schools receive more revenue, and the children in that school district receive better schooling. The reverse is true for less affluent families, which creates an additional systemic barrier to intergenerational social mobility. We tried to verify the extent to which this logic was true by examining educational achievement and spending across school districts. Studies support the claim that increased per-pupil spending results in improved student performance-one particular study found that this was because increased funding gave students access to educated teachers who adopted effective pedagogies in their classrooms. Using GIS, we mapped trends in school district funding and student performance on the statewide standardized Regents exams. The results of this project can be used to develop educational policy and to address structural issues in public school funding.
Methods:
The maps in this project were created with data from the years 2011 and 2012.
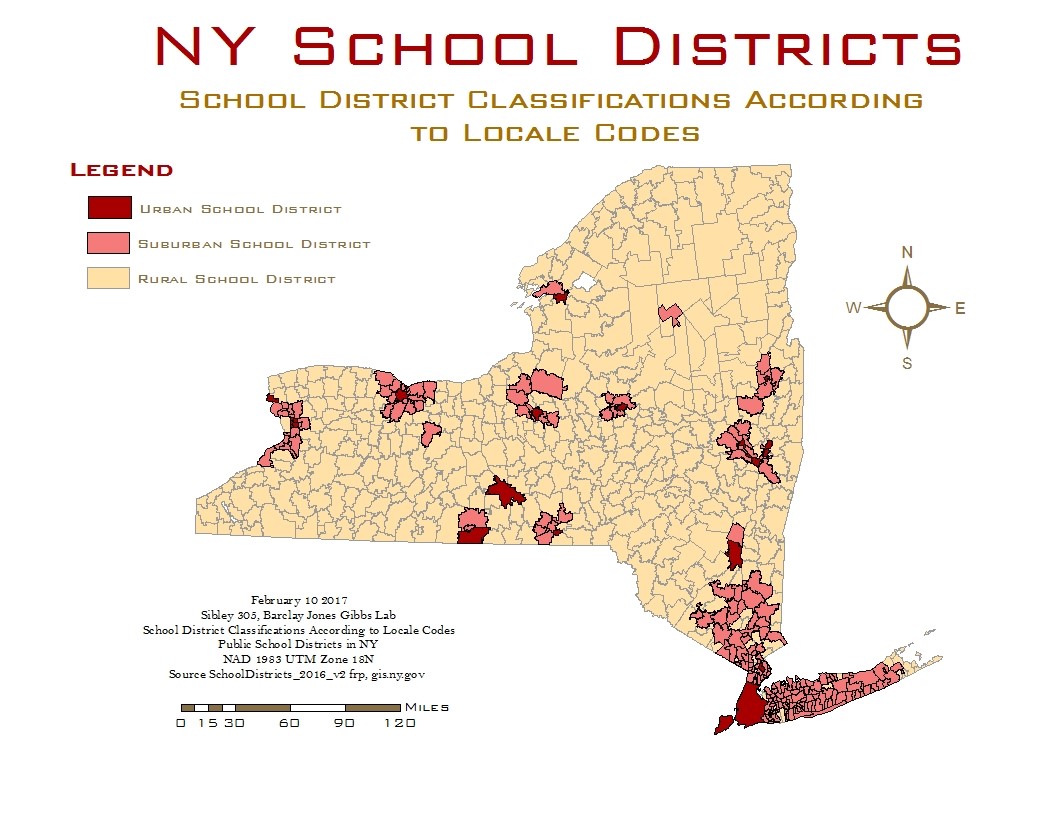
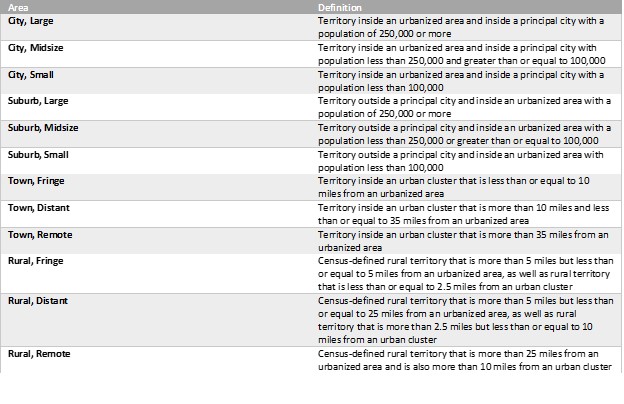
The definitions of “rural,” “suburban,” and “urban” used in our project are derived from the National Center for Educational Statistics’ (NCES) “locale code” classification system. By calculating the distances between school addresses and urbanized areas, this system groups schools into the following categories: cities, suburbs, towns, and rural areas. See Appendix for full locale code definitions.
Assuming that New York seeks to achieve the greatest possible utilitarian improvement in its public education system, we used an algorithm to identify school districts that would theoretically receive the most benefit from increased state funding. There were two primary components of the algorithm: 1) educational achievement ranking, as reflected by Regents exam scores and 2) financial need, which was derived from educational spending and dependence on state funding.
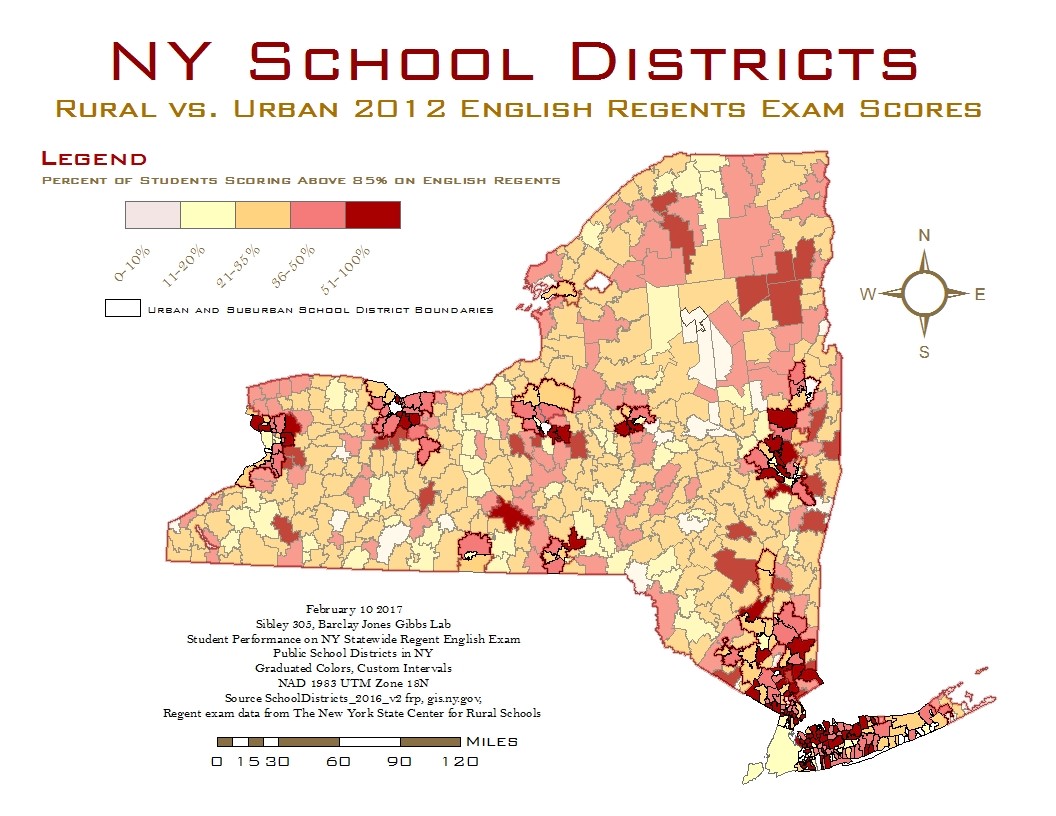
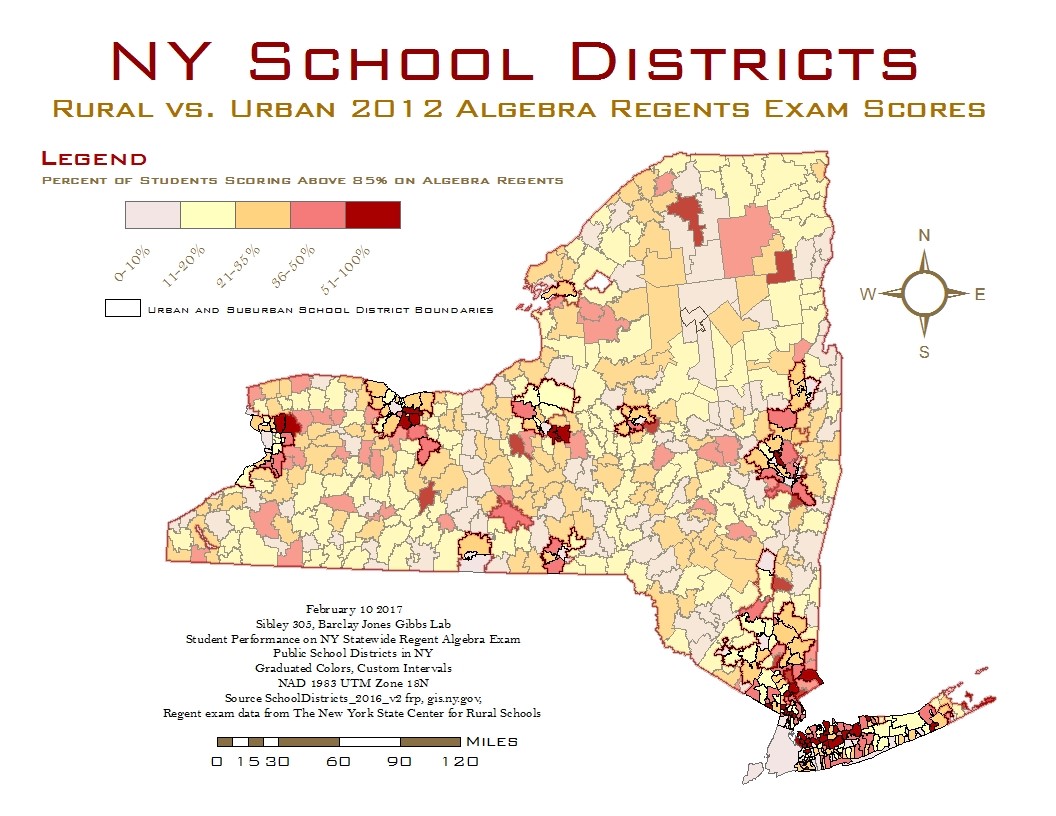
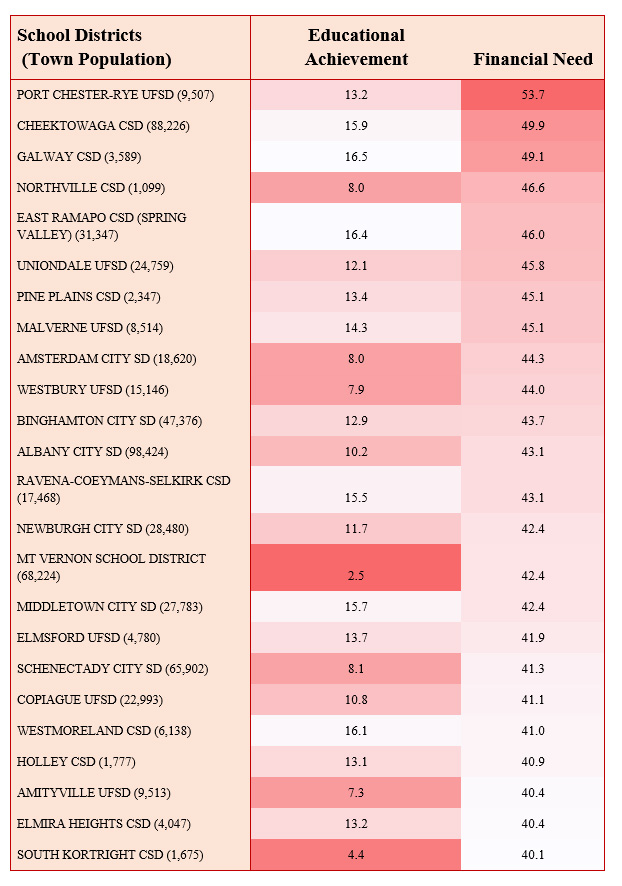
The metric of “educational achievement” reflects a composite of Algebra and English Regents exam scores: more specifically, the percentage of students scoring at or above 85% on these exams indicated the district’s educational achievement. For instance, a school district in which 50% of students scored above an 85 on the English Regents exam and 40% scored above an 85 on the Algebra Regents exam would have a composite Educational Achievement score of 45.
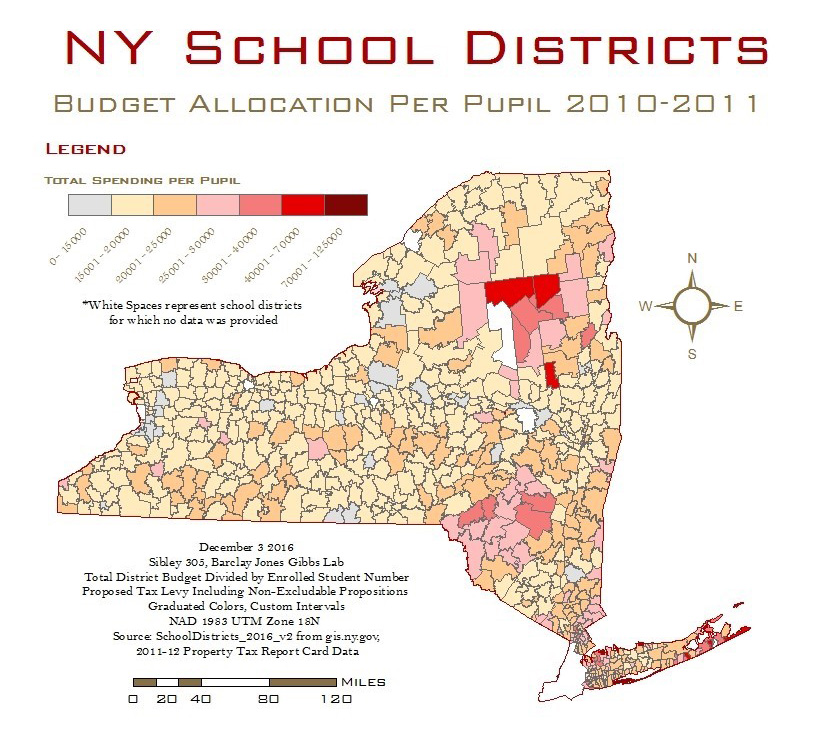
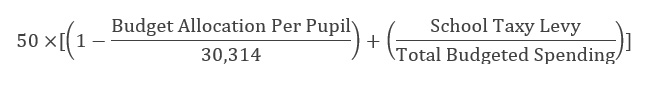
Our metric for “financial need” is based on each school district’s per-student budget allocation and its dependency on local property taxes for public education funding. Presumably, school districts that have smaller budgets which are more heavily funded by local property taxes receive especially inadequate external (non-local) education funding. It is not explicitly codified in policy that schools receiving more funding from property taxes will receive less state funding, but this project specifically analyzed school districts where that was the case. There is no baseline ratio of local-to-state funding for district and, as a result, certain districts gain and while others lose from this system. Our formula for financial need was determined by evaluating each district’s per-student budget allocation as a percentage of a value that is 2 standard deviations above the mean budget allocation. We then completed the formula by including how much of the district’s budget comes from local property taxes. Schools that have lower per-student spending combined with a high dependency on local property taxes will have a higher score for financial need. Specifically, the formula we used was:
In assessing which school districts are most affected by wealth inequality, we cross-referenced them to find districts for which there was the highest correlation between high dependency on inadequate local property taxes and low educational achievement. Subsequently, we analyzed in aggregate the difference between rural and urban/suburban areas in their “need” for increased external funding for education based on our metrics of evaluation.
Conclusion:
After sorting New York State school districts into categories according to educational achievement and financial need, we selected all the school districts with the lowest Regents exam performance as well as above-average financial need. Only the 100 lowest academically performing school districts were pre-selected before evaluating each district’s financial need. Increasing state and federal funding for education to these schools should have the largest overall impact and increase educational equality in New York state. Of the twenty-five selected school districts, only a handful would be classified as being part of an “urban” area, or having a population of over 50,000. However, it is worth noting that Buffalo, Syracuse, and New York City school districts were excluded from this study due to their omission in our source datasets. Increased funding to these school districts should in theory cause the greatest improvement in the state’s overall public education performance.
We make our recommendations with a few caveats. First, the maps in this article depict correlations between school district funding and scores on the statewide New York Regents Algebra and English exams. However, it is insufficient to look solely at Regents exam scores as an indicator of student performance-an array of other indicators could shed light on potential patterns in school district funding and student performance. Further research should be conducted in order to better understand the correlations between district funding and other indicators of student performance, such as retention, graduation rates, and educational attainment.
It is also necessary to consider that increased funding in a given school district might not improve student performance. Factors outside of school district funding may create unfavorable conditions for students to perform well-for example, rising proportions of children living in single-parent families and, additionally, childhood poverty rates. These conditions may particularly inhibit the performance of students in Rust Belt school districts, where increased unemployment rates have constricted family inputs to education. It is difficult to discern whether or not increasing state and federal funding to public schools can effectively offset changes in family inputs.
However, we believe that there is h2 enough evidence to safely assume relatively positive outcomes of increasing state education funding to the school districts we have specified. Wealthier, high-performing school districts were not included because of the “poor achievement” formula pre-screening. Of the lower-performing school districts, only those with low budgets and low non-local funding were recommended. These schools should be able to benefit most from an increase in state funding to their education budgets, which could then lead to greater equality among New York State school districts.
Appendix:
School Finance: Education Quality Counts. (2016). Education Week Resource Center. Retrieved from: http://www.edweek.org/media/school-finance-education-week-quality-counts-2016.pdf
Turner, Cory. "Why America's Schools Have a Money Problem." National Public Radio, 18 April 2016
Elliot, M. (1998) School finance and opportunities to learn: Does money well spent enhance students' achievement? Sociology of Education, 223-245
Lafortune, J., Rothstein, J., & Schanzenbach, D. W. (2016). School finance reform and the distribution of student achievement (No. w22011). National Bureau of Economic Research.
Hanushek, Eric A. "The failure of input?based schooling policies." The Economic Journal, 113.485 (2003): F64-F98.
Bentley, George C., et al. "Race, class, unemployment, and housing vacancies in Detroit: an empirical analysis." Urban Geography 37.5 (2016): 785-800.


